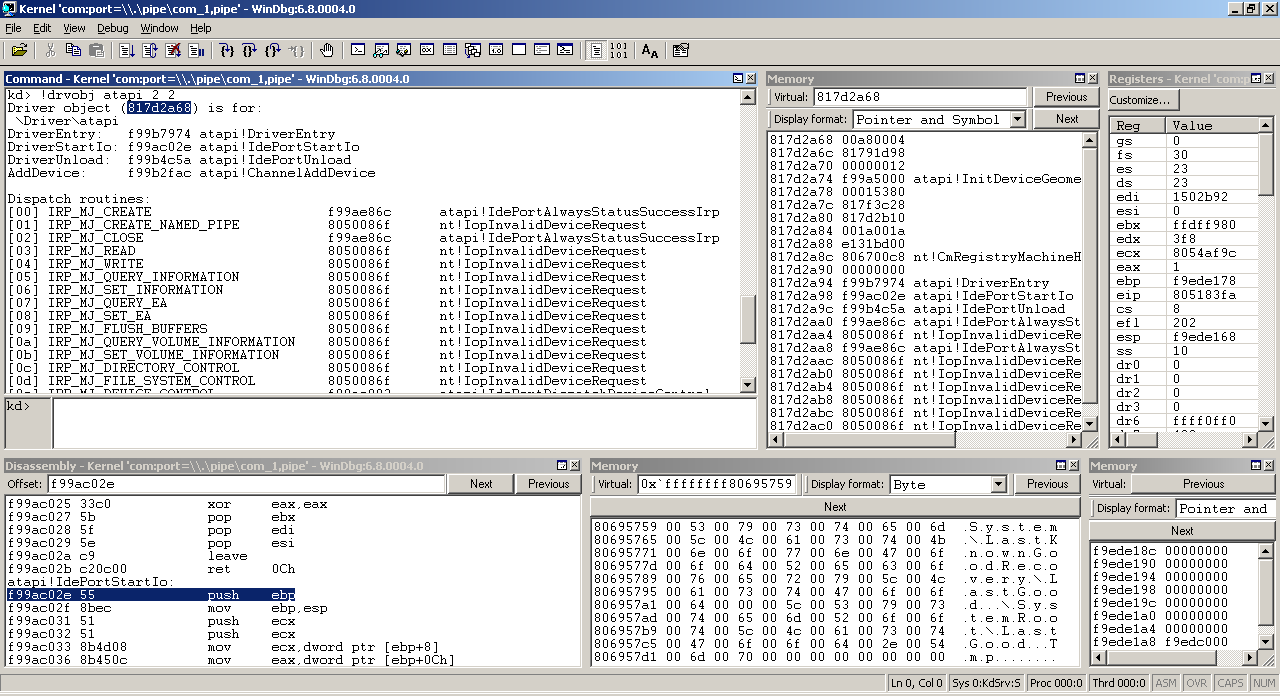
WinDbg Cheat SheetAuthor: David Zimmer Date: 05.08.10 - 5:28am Everyone ends up creating their own Windbg cheat sheet to help them along as learn Windbg. I have found others sheets very helpful as i went so here are the notes i have compiled. The Windbg UI can include many different dockable windows. You can also open multiple ones of the same type (I like to keep multiple memory windows open so I can chase down pointers and see things in different formats). Getting a Window configuration and layout you are comfortable and efficient with can take a bit of fussing (luckily windbg saves your layout across runs). Here is what I have found comfortable for me. 
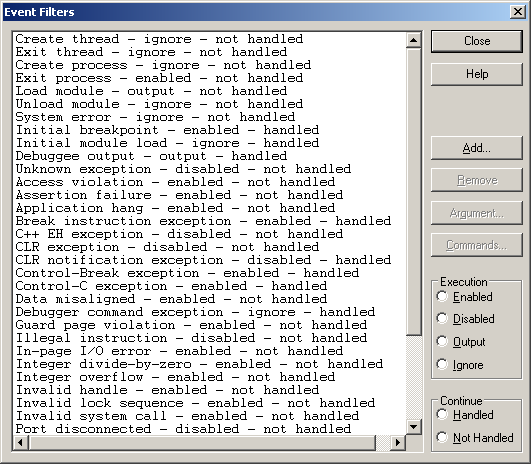
When you set breakpoints, you can include commands to be executed I often find it helpful to add a label like bp 0x41414141 ".echo in function x" You can also have analyze data for you. Here are some useful breakpoints that analyze arguments bp nt!ZwCreateFile "du poi(poi(esp+10)+0xC);g" bp kernel32!LoadLibraryExA "da poi(esp+4);g" bp kernel32!LoadLibraryExW "du poi(esp+4);g" bp kernel32!LoadLibraryA "da poi(esp+4);g" bp DbgPrint "da poi(esp+4)" bp nt!zwopenfile "du poi(poi(esp+10)+0xC)"You can also set conditional break points bp 41414141 "j @eax=0xbaadf00d ;g" which means "break at address 41414141 if eax = 0xbaadf00d else go" One shot breakpoints can be set with bp 0x41414141 /1 You can also set breakpoints inside of loops and set them to only break after being hit x times. bp 0x41414141 x You can also set memory access breakpoints. The format is ba (break access) [op][size] where op is operation (rwe) and size is length to trigger on. I think size must be aligned to a 4 byte boundry. if 4 fails use 1 ba w4 41414141 ba r1 41414141To edit a byte in memory: (change value at addr 41414141 to 55 (push ebp)) eb 0x41414141 55 If you want to manually change eip an address you desire: r @eip=0x41414141 You can dump memory to disk using the .writemem command. You can either dump a range with two addresses as the arguments, or you can specify a start address and a length to dump by length. You can also add a ? to the length specifier to bypass length checks. .writemem c:hostmachine ange.bin 0x0400000 0x0404000 .writemem c:hostmachinelength.bin 00400000 L4000 .writemem c:hostmachinelength.bin 00400000 L?4000The kernel includes a table of function pointers like the import address table does in a user mode app. Its called the KiServiceTable and you can view it in memory by entering its symbol address in a memory window and viewing the data as pointer and symbol mode. nt!KiServiceTable 804742b8 8049dd52 nt!NtAcceptConnectPort 804742bc 804af6c1 nt!NtAccessCheck 804742c0 804b043a nt!NtAccessCheckAndAuditAlarm 804742c4 8050d5b8 nt!NtAccessCheckByType 804742c8 804b0470 nt!NtAccessCheckByTypeAndAuditAlarm ...To get a dump of a driver table you can use the drvobj command. it has a lot of useful info on function pointers and events it implements. This info is not available at very early stages of system loading though. table has to be initilized first. !drvobj atapi 2 2 If you want to see which modules are loaded you can use the lm command. To see the entire device node tree, you can use the following command: !devnode 0 1 If you want to start teh debugger at a very very early stage of system startup you can install a debug boot loader from the relevant ddk. (ntldr_dbg) This will let you break before even the OS selection prompt shows up and when only osloader.exe is loaded. For more details check out this helpful article Windows Boot Debugger If you want to break early in teh boot, but not necessarily boot loader early, you can request to stop at the initial breakpoint by going to Debug->Kernel Connection -> Cycle Initial Break (or hitting ctrl+alt+K and rebooting) You can reboot the target machine by issuing a .reboot command. You can also have Windbg break on many different events such as new process, or thread module loading etc. Check out the event filters dialog. 
To set breakpoints in user mode sections of memory you have to be in teh correct process. You will have to Changing Context and then reload your symbols.
During kernel-mode debugging, you can set the process context by using the .process (Set Process Context) command. Use this command to select which processs page directory is used to interpret virtual addresses. After you set the process context, you can use this context in any command that takes addresses. You can even set breakpoints at this address. By including a /i option in the .process command to specify invasive debugging, you can also use the kernel debugger to set breakpoints in user space.
You can also set user-mode breakpoints from the kernel debugger by using a process-specific breakpoint on a kernel-space function. Set strategic breakpoints and wait for the appropriate context to come up. With WinDBG, another thing you can do is use !bpid to have the kernel debugger break into the context of the process you e interested in and then you can set your breakpoints in the user-mode code (after running .reload to reload your symbols). For example, setting a breakpoint in CreateFileW in a process: 0: kd> !process 0 0 **** NT ACTIVE PROCESS DUMP **** .... PROCESS 861c9d90 SessionId: 1 Cid: 0f10 Peb: 7ffd3000 ParentCid: 0b48 DirBase: 0174e2a0 ObjectTable: 96f14eb0 HandleCount: 5. Image: testapp.exe 1: kd> .process /r /p 861c9d90 Implicit process is now 861c9d90 ..cache forcedecodeuser done Loading User Symbols break on all exports for a dll bm /a kernel32!* Another interesting article from MS Controlling the User-Mode Debugger from the Kernel Debugger A couple more links: Comments: (0) |
About Me More Blogs Main Site |