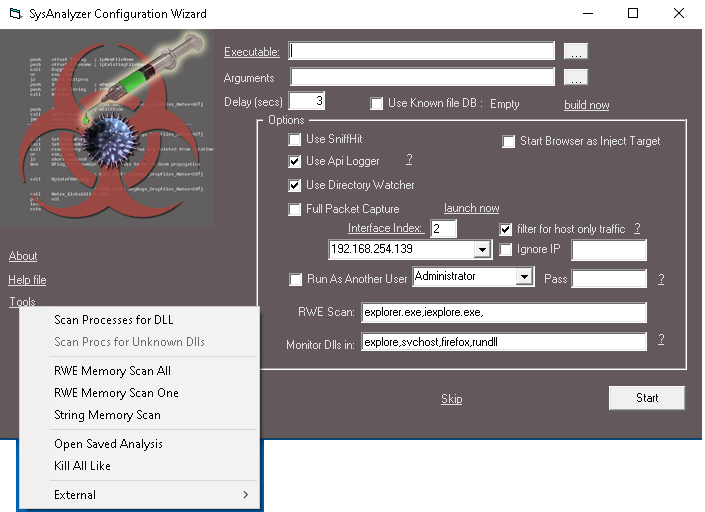
The configuration wizard is the first screen shown when SysAnalyzer launches. Fields are persistent — settings are saved to cfg.dat on close and restored on next launch.
If SysAnalyzer is launched on Vista or later without elevation, it auto-relaunches elevated. If UAC is unavailable and the user is not a local admin, the wizard shows a banner indicating reduced functionality.
| Field | Purpose |
|---|---|
| Executable | Path to the file under analysis. Accepts EXE, DLL, and any registered shell-handler extension (DOC, PDF, HTML, JS, etc). Also accepts pid:NNNN to attach the API logger to an existing process. Drag-and-drop is supported. |
| Arguments | Command-line arguments passed to the executable. For shell-handled file types (PDF, DOC…), put the viewer in Executable and the file path here. Drag-and-drop is supported. |
| Delay (secs) | Seconds to wait between launching the target and taking Snapshot 2. Default 30. |
Below each path, a status label shows compile date and PE type (32/64-bit, .NET, etc) for sanity checking.
loadlib.exe (32-bit) or x64Helper.exe (64-bit). Just point Executable at the DLL.| Option | Effect |
|---|---|
| Use Api Logger | Inject api_log.dll into the target at launch and stream API calls into the Api Log tab. Right-click the "?" label to read a stability note.Right-click the option label to toggle dll-name randomization (a "- R" suffix appears on the caption when active). Useful when the sample checks for api_log.dll by name. |
| Use SniffHit | Launch sniff_hit.exe in the background to record HTTP/DNS/IRC traffic. |
| Full Packet Capture | Launch win_dump.exe to capture full packets to capture.log (or capture_N.log) on the desktop. |
| Use Directory Watcher | Start file-system monitoring at launch. Modified files are auto-copied into [analysis]\DirWatch\ for later inspection. |
| Option | Effect |
|---|---|
| Interface Index | libpcap interface index for windump. Click the "?" to spawn win_dump.exe -D in a console showing all interface indices on the host. |
| IP | The IP of the chosen interface (auto-populated; only shown when more than one interface is available). |
| filter for host only traffic | Restrict the capture filter to ip src [host] or ip dst [host]. Generally on, unless you are looking at a sample that spoofs source addresses. |
| Ignore IP | Append and not (ip src X or ip dst X) to the capture filter. Use to drop noise from a known-uninvolved IP (e.g. an analyst workstation). |
| Option | Effect |
|---|---|
| Start Browser as Inject Target | Launches a "goat" browser window before the target, giving injectors something stable to attach to. Started during wizard load (not on Start) so the browser has time to settle before the snapshot. |
| Monitor Dlls in | Comma-separated process-name fragments. SysAnalyzer takes a DLL snapshot for any running process whose path contains one of these substrings. explore matches both explorer.exe and iexplore.exe. Use * to monitor every process. Double-click the label to restore defaults (explore,svchost,firefox,rundll). |
| RWE Scan | Comma-separated process-name fragments. After the second snapshot, these processes get scanned for RWE memory regions even if the malware did not spawn them — useful for catching injection into pre-existing host processes. |
| Run As Another User | Launch the target under a non-admin account. Username dropdown is auto-populated from local accounts.
|
Checking Use Known file DB filters the displays in the main UI to hide files the database has marked as trusted. The label next to the checkbox shows DB state: Loaded, Empty, or Not found. Click build now to populate the database. See Known File DB.
| Control | Action |
|---|---|
| Start | Validate inputs, launch live-logging components, take Snapshot 1, launch the target, start the countdown. |
| Skip | Skip launching anything; jump straight to the main UI with a base snapshot taken. Use this for live-system inspection or when you want to drive snapshots manually. |
| Tools | Popup menu (see below). |
| Help file | Open this help file (CHM). |
| About | Version info. |
Available from the Tools button on the wizard. These actions do not require a target binary and are useful for ad-hoc inspection of the running system.
| Item | Action |
|---|---|
| Scan Processes for DLL | Prompt for a DLL name; lists every running process that has it loaded. |
| Scan Procs for Unknown Dlls | Same scan, but reports only DLLs not present in the Known File DB. Disabled if the DB is empty. |
| RWE Memory Scan All | Scan every running process for RWE-marked memory regions. Results in a viewer; double-click any region to dump it. |
| RWE Memory Scan One | Same scan, single process selected from a picker. |
| String Memory Scan | Open the deep memory scanner (see Memory tools). |
| Open Saved Analysis | Browse to an existing analysis folder and open it in the Report Viewer. |
| Kill All Like | Prompt for a name fragment; terminate every process whose path matches (case-insensitive substring). The wizard process itself is excluded. |
| External → Sniffhit | Launch sniff_hit.exe standalone. |
| External → ProcWatch | Launch proc_watch.exe standalone. |
| External → Api Logger | Launch the standalone API-logger UI (no target required; can attach by PID). |
| External → DirWatch | Launch the standalone directory-watcher UI. |
| External → Command Prompt | Open cmd.exe elevated (caption shows "32bit Elevated" on Vista+). |
| External → Run As Trusted Installer | Spawn a shell as TrustedInstaller for inspecting protected paths. |
| External → Edit Hosts File | Open C:\Windows\System32\drivers\etc\hosts in Notepad. |
Wizard state is persisted to two locations:
cfg.dat in the application directory — binary blob holding the main checkboxes, delay, interface index, and ignore-IP setting.txtRWEScan, txtMonitorDlls, chkFilterHostOnly, and the snapshot/diff toggle states.Saved on every wizard exit (Start or Skip or close). To reset to defaults, delete cfg.dat.