SysAnalyzer ships several memory inspection tools: an RWE injection scanner, a deep memory string scanner, a per-process memory map viewer, and an embedded hex viewer. All four work against 32-bit and 64-bit processes via the bundled x64Helper.exe bridge.
An RWE region is a memory allocation marked read + write + execute. Outside JIT engines (browsers, .NET runtimes, the JS engines), RWE allocations are an unusual choice and a common signature of code injection.
| From | Action |
|---|---|
| Wizard → Tools → RWE Memory Scan All | Scan every running process. |
| Wizard → Tools → RWE Memory Scan One | Pick a single process from a chooser. |
| Main UI → Tools → RWE Memory Scan All | Same as wizard equivalent. |
| Right-click → RWE Mem Scan | Scan the selected process. |
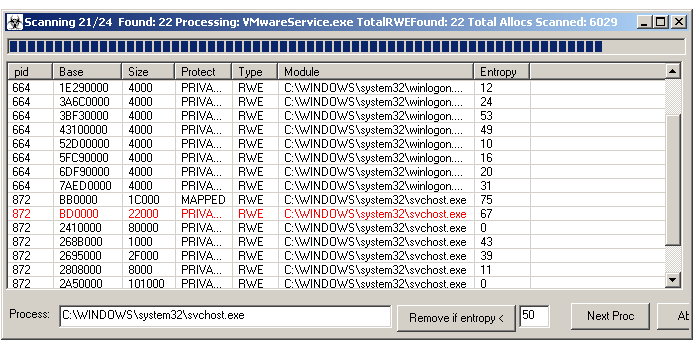
The scan opens a list of RWE regions across all scanned processes. Columns: PID, region base, size, protection, type, owning module (if any), and entropy. Entries shown in red have an MZ header at the start of the region — these are PE images mapped into RWE memory and are essentially always malicious.
Actions on a result row:
Real injected payloads are dense (encrypted blobs, packed code, raw shellcode); the legitimate RWE allocations from JIT engines and runtime stubs are usually much lower entropy. The Remove if entropy < N control at the bottom of the results window strips entries below the threshold, leaving the high-entropy candidates that warrant inspection. Tweak the threshold against the sample — 50 is a reasonable starting point.
Next Proc aborts the current process and moves to the next, useful when one process has thousands of allocations to walk and you'd rather sample broadly than wait.
Searches every memory allocation of every process (or a single PID) for a user-supplied pattern. Useful for finding C2 strings, configuration blobs, decoded payloads, and shellcode signatures across the whole live system in one pass.
| From | Behavior |
|---|---|
| Wizard → Tools → String Memory Scan | Scanner opens with the full process list. |
| Main UI → Tools → String Memory Scan All | Same. |
| Right-click → Memory Search | Scanner opens filtered to the selected PID. |
The pattern field is interpreted as a regex against both ASCII and UTF-16LE encodings of every memory page. \xNN escapes are supported, so binary signatures work directly:
| Pattern | Matches |
|---|---|
| payload | The literal word "payload" anywhere, ASCII or Unicode. |
| https?://[^\s]+ | HTTP/HTTPS URLs. |
| \x90\x90\xeb\x15 | Specific shellcode prologue bytes. |
| [A-Za-z0-9+/]{40,}=* | Long base64-looking strings. |
Search is case-insensitive.
| Control | Behavior |
|---|---|
| Process list (left) | Multi-select, supports filter and delete. Trim it before searching to focus the scan. |
| Search | Begin scan against everything currently in the process list. |
| Next Proc | Skip the current process and move to the next. Useful when one process has many regions to scan. |
| Abort | Cancel the entire scan. |
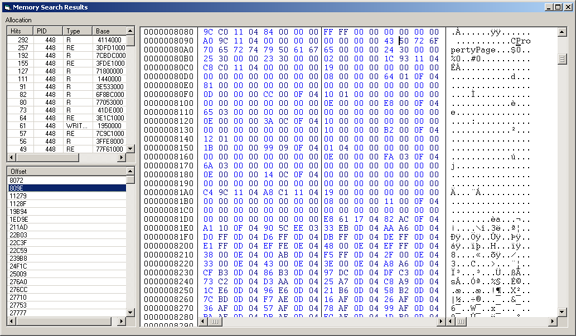
Hits open in a results viewer with PID, region base, offsets within the region, and a hex preview around each match. Double-click a hit to open the region in the hex viewer scrolled to the offset.
Right-click a process and choose Memory Map to open the per-process memory map. Every allocation is shown with:
Right-click a region for the same actions as the RWE scan results: dump to file, open in hex viewer, or pivot into the string scanner against just that region.
The embedded hex viewer is reached by double-clicking a result row in any of the memory tools, or by clicking a binary file with the red "b" icon in the Report Viewer. Features:
\xNN binary patterns).Memory dumping, RWE scanning, and the string scanner all work transparently against 64-bit processes from the 32-bit SysAnalyzer host via x64Helper.exe. The 64-bit indicator *64 appears in tool list views next to relevant entries.