Malcode Call API by HashAuthor: David Zimmer Date: 05.12.10 - 6:18am Its standard MO for shellcode and packers to lookup all of the api they need by hash value, store the pointers in a table, and then reference this table for all their api needs. Malicious code authors have taken a liking to this and have started to use this technique as their main way to call every single external api they access. As an added headache for RE guys, they also dont bother caching any of the results and storing them in a pointer table, they prefer to just call the hashing routine each time fresh. An example might look like this: seg000:814EB7DC push 89379244h seg000:814EB7E1 call Get_NT_DLL_Base seg000:814EB7E6 push eax seg000:814EB7E7 call GetApi_By_Hash seg000:814EB7EC push esi seg000:814EB7ED call eaxThis is a pretty effective technique because no single pointer entry can be renamed in IDA to make the code readable. Instead you have to search and find every push [hash val] and then add a comment at each one with which api that represents. In a pointer table scenario, you wait for the table to get filled out, then you can just dump in Olly and it will tell you which address aligns to which api all at once. when the addresses arent stored anywhere, you have to generate your own listing of the all of the possible hash values for a given dll. In order to do this it takes much more work and you have to do some custom analysis and programming. For user land stuff, I use my iDBG library to extract data at breakpoints. For kernel land, you have to use WinDbg. As an example here is a clip of a hash lookup function: seg000:814EBC72 next_import: seg000:814EBC72 mov eax, [ebp+arg_0] seg000:814EBC75 mov eax, [edi+eax*4] seg000:814EBC78 add eax, esi seg000:814EBC7A push eax ; api export name seg000:814EBC7B call generate_hash seg000:814EBC80 cmp eax, [ebp+arg4_hash_val] ;eax=its hash val seg000:814EBC83 jz short match_found seg000:814EBC85 inc [ebp+arg_0] seg000:814EBC88 mov eax, [ebp+arg_0] seg000:814EBC8B cmp eax, [ebp+var_4] seg000:814EBC8E jb short next_importAnd the WinDbg breakpoints to log the data i need: bp 814ebc7a "da eax;g" bp 814ebc80 "?eax;g" bp 814ebc90 ".echo dumping complete"This code is called in a loop that cycles through all of the exports of NTDLL. So to start logging you have to set a bp at the function start the logging breakpoints mentioned above, and a breakpoint at each exit path to the function. You also have to edit the arg4_hash_val so it never finds a match and cycles through all of the exports. The reason for the bp at the function start is important, because you want to make sure in your messy logging dump that no other threads enter the mix and screw up your dump. To get a clean dump, I had to create it at a very early stage of system startup when the rootkit was just initilizing and before any user processes were running. If that doesnt sound like a pain in the ass yet, i dont know what does! but were still not done. now we have a long text file like: 805405c5 "CcCanIWrite" Evaluate expression: 1600456038 = 5f650566 805405d1 "CcCopyRead" Evaluate expression: 1163106347 = 4553982bThat has to be parsed into a clean format and it has to be verified that all values align and are correct with observed results. Once that is done, now we have to do a bulk search of the disassembly for each time one of these hash values are pushed onto the stack and then add a comment to each one with the human readable api name so the disasm is readable. (again there is no standard tool for this task, you have to write a custom script of plugin): Even after all of that...the disasm is still broken in regards to being readable to some things. One tool which can be very handy is IDAs "Chart References From" call browser. With this, you click on a function and you can see all the functions called within its call chain. WHen the malcode guys program in this way, all you see are teh references to GenerateHash and not a chain of the actual API that are being called. Some malcode even take it a step further in that instead of a direct call eax in the main body of the function where its used, they handle the call within the hashing function, which makes even api logging and direct return address logging useless because it always shows the exact same return address for every single API accessed. (Unless you modify your Api logging code to extract the next return address on the stack and log that instead of the current one, can be done but just another pita) Of course they know all of this, which is exactly why they do it. Cat and mouse So..if we have to deal with code like this, we have to develop tools to automate all of these steps or at least make it more managable to deal with in a semi efficient manner. So just to keep track of the score. Calling all api by hash like this forces us to:
I ended up writing a quick plugin to handle this task. Generically its a search form that lets you add bulk comments to all the search results in one click. For more specialized tasks and for automation, i made it scriptable and gave the scripts access to some powerful wrapped functions. So the script loads a text file of all the hash to name values, cycles through them all one at a time, does a search, adds comments, then scans the next call eax and adds a xref there so its graphable. Screen shot below with the core logic from the vbs script. Worked out pretty spiffy and all specialized code is in the vbs script which can be easily written per task. 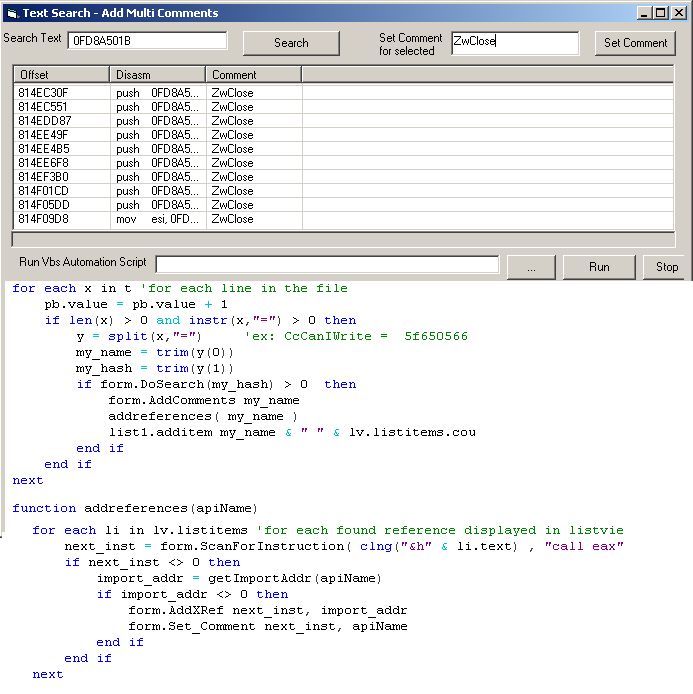 Comments: (4)On 05.12.10 - 7:37am Dave wrote:
On 05.12.10 - 7:54am Dave wrote:
On 05.12.10 - 8:34am Dave wrote:
On 01.10.11 - 6:10am Dave wrote:
|
About Me More Blogs Main Site
|
||||||||||||||||||||||||||||||||