Per-process analysis is invoked automatically against every newly-spawned process when the countdown ends, and on demand via the right-click Analyze menu on Running Processes, Open Ports, and Process DLLs tabs.
The standalone proc_analyzer.exe companion (installed alongside SysAnalyzer) does the same job for arbitrary running processes outside an analysis run.
For a given PID, the Analyze action performs in order:
[analysis]\[procname]\[procname]_sample.exe_ with a trailing underscore so the file is not auto-executed.[procname]_dmp.dll.dmp, run a quick PE-section alignment fix, then run strings on the dump (skipping if larger than 20MB). Modules whose hash matches the DB are skipped — the optimization is what makes Analyze tractable on large processes.[procname]_dmp.exe_, fix alignment, and run strings.[procname]_rwe_[base].bin. RWE regions starting with an MZ header are flagged as known-bad in the report.Output goes into [Desktop]\analysis\[procname]\. When the run finishes, the Report Viewer opens on the analysis root.
The RWE Scan field on the wizard takes a comma-separated list of process-name fragments (default explorer.exe, iexplore.exe). At the end of the run, every matching running process is RWE-scanned even if the malware did not spawn it. This is how SysAnalyzer catches injection into stable host processes.
To extend the list at run-time, edit the RWE Scan textbox on the wizard before starting. The setting persists across runs.
In-memory PE layouts have section virtual addresses that differ from raw on-disk file offsets. After dumping, SysAnalyzer applies a "quick dump fix" that rewrites section headers to align with the dumped layout, producing a file most static-analysis tools will accept.
This is not a full unpacker — the fix does not rebuild imports. For loaders that require IAT reconstruction, dump and then run a dedicated tool (Scylla, X64Dbg's Scylla plugin, etc) against the dumped image.
Strings dumps are produced from each memory dump and parsed for:
The parsed lists are appended to the per-process report, which makes triage faster than scrolling raw strings output.
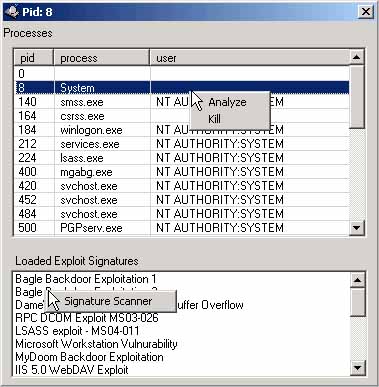
Run proc_analyzer.exe directly to analyze any running process without going through SysAnalyzer's snapshot flow. The UI presents two list views — running processes on top, exploit signatures on the bottom — with the same right-click Analyze action.
Command-line invocation:
proc_analyzer.exe <pid> [/i]
| Argument | Description |
|---|---|
| <pid> | Process ID to analyze. Required. |
| /i | Interactive mode — show the UI after analysis. Without it, runs headless and exits. |
Signatures are loaded from exploit_signatures.txt in the application directory at startup. Format is one entry per line, ini-style:
SignatureName = pattern
Patterns may be plain text or escaped bytes:
EggHunter = \x66\x81\xCA\xFF\x0F\x42\x52\x6A\x02
ShellPrompt = cmd.exe /c