Note: iDefense no longer maintains a labs software download page.
Being the original author of these tools, I have decided to pick up support for them
and continue to do maintence in my spare time.
SysAnalyzer Overview
SysAnalyzer is an open source application that was designed to give malcode analysts an automated tool to quickly collect, compare, and report on the actions a binary took while running on the system.A full installer for the application is available and can be downloaded here . The application supports windows 2000 - windows 10. Including x64 support.
The main components of SysAnalyzer work off of comparing snapshots of the system over a user specified time interval. The reason a snapshot mechanism was used compared to a live logging implementation is to reduce the amount of data that analysts must wade through when conducting their analysis. By using a snapshot system, we can effectively present viewers with only the persistent changes found on the system since the application was first run.
While this mechanism does help to eliminate allot of the possible noise caused by other applications, or inconsequential runtime nuances, it also opens up the possibility for missing key data. Because of this SysAnalyzer also gives the analyst the option to include several forms of live logging into the analysis procedure.
When first run, SysAnalyzer will present the user with the following configuration wizard:
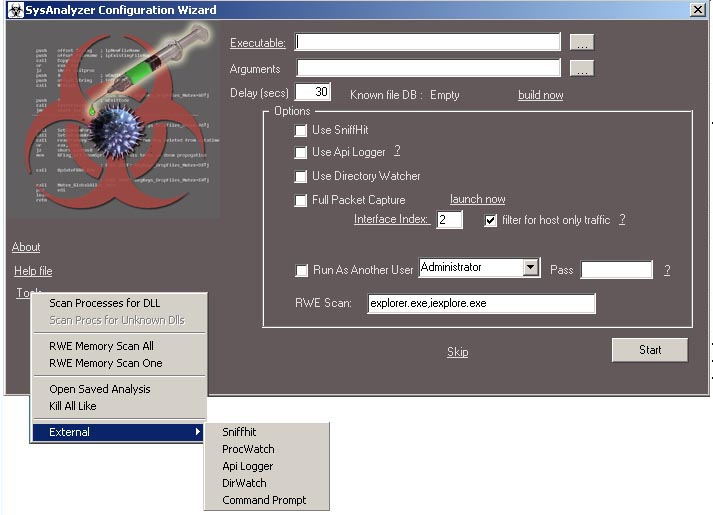
The executable path textbox represents the file under analysis. It can be filled in either by
- Dragging and dropping the target executable on the SysAnalyzer desktop icon
- Specifying the executable on the command line
- Dragging and Dropping the target into the actual textbox
- Using the browse for file button next to the textbox
there are handful of options available on the screen for optional live logging components such as full packet capture, API logger, and sniff hit. you can also run it as another user.
These options are saved to a configuration file and do not need to be entered each time. Note that users can also select the "Skip" link in order to proceed to the main interface where they can manually control the snapshot tools.
note that the API logger option is generally stable but not entirely so in every case. I generally reserved this option for when I need more information than a standard analysis provides.
Once these options are filled in and the user selects the "Start button" the options will be applied, a base snapshot of the system taken, and the executable launched.
Note: SysAnalyzer is not a sandboxing utility. Target executables are run in a fully live test on the system. If you are testing malicious code, you must realize you will be infecting your test system.
SysAnalyzer's is designed to take snapshots of the following system attributes:
- Running processes
- Open ports and associated process
- Dlls loaded into explorer.exe and Internet Explorer
- System Drivers loaded into the kernel
- Snapshots of certain registry keys
- Run time file modifications
- Scheduled tasks
- Mutexes
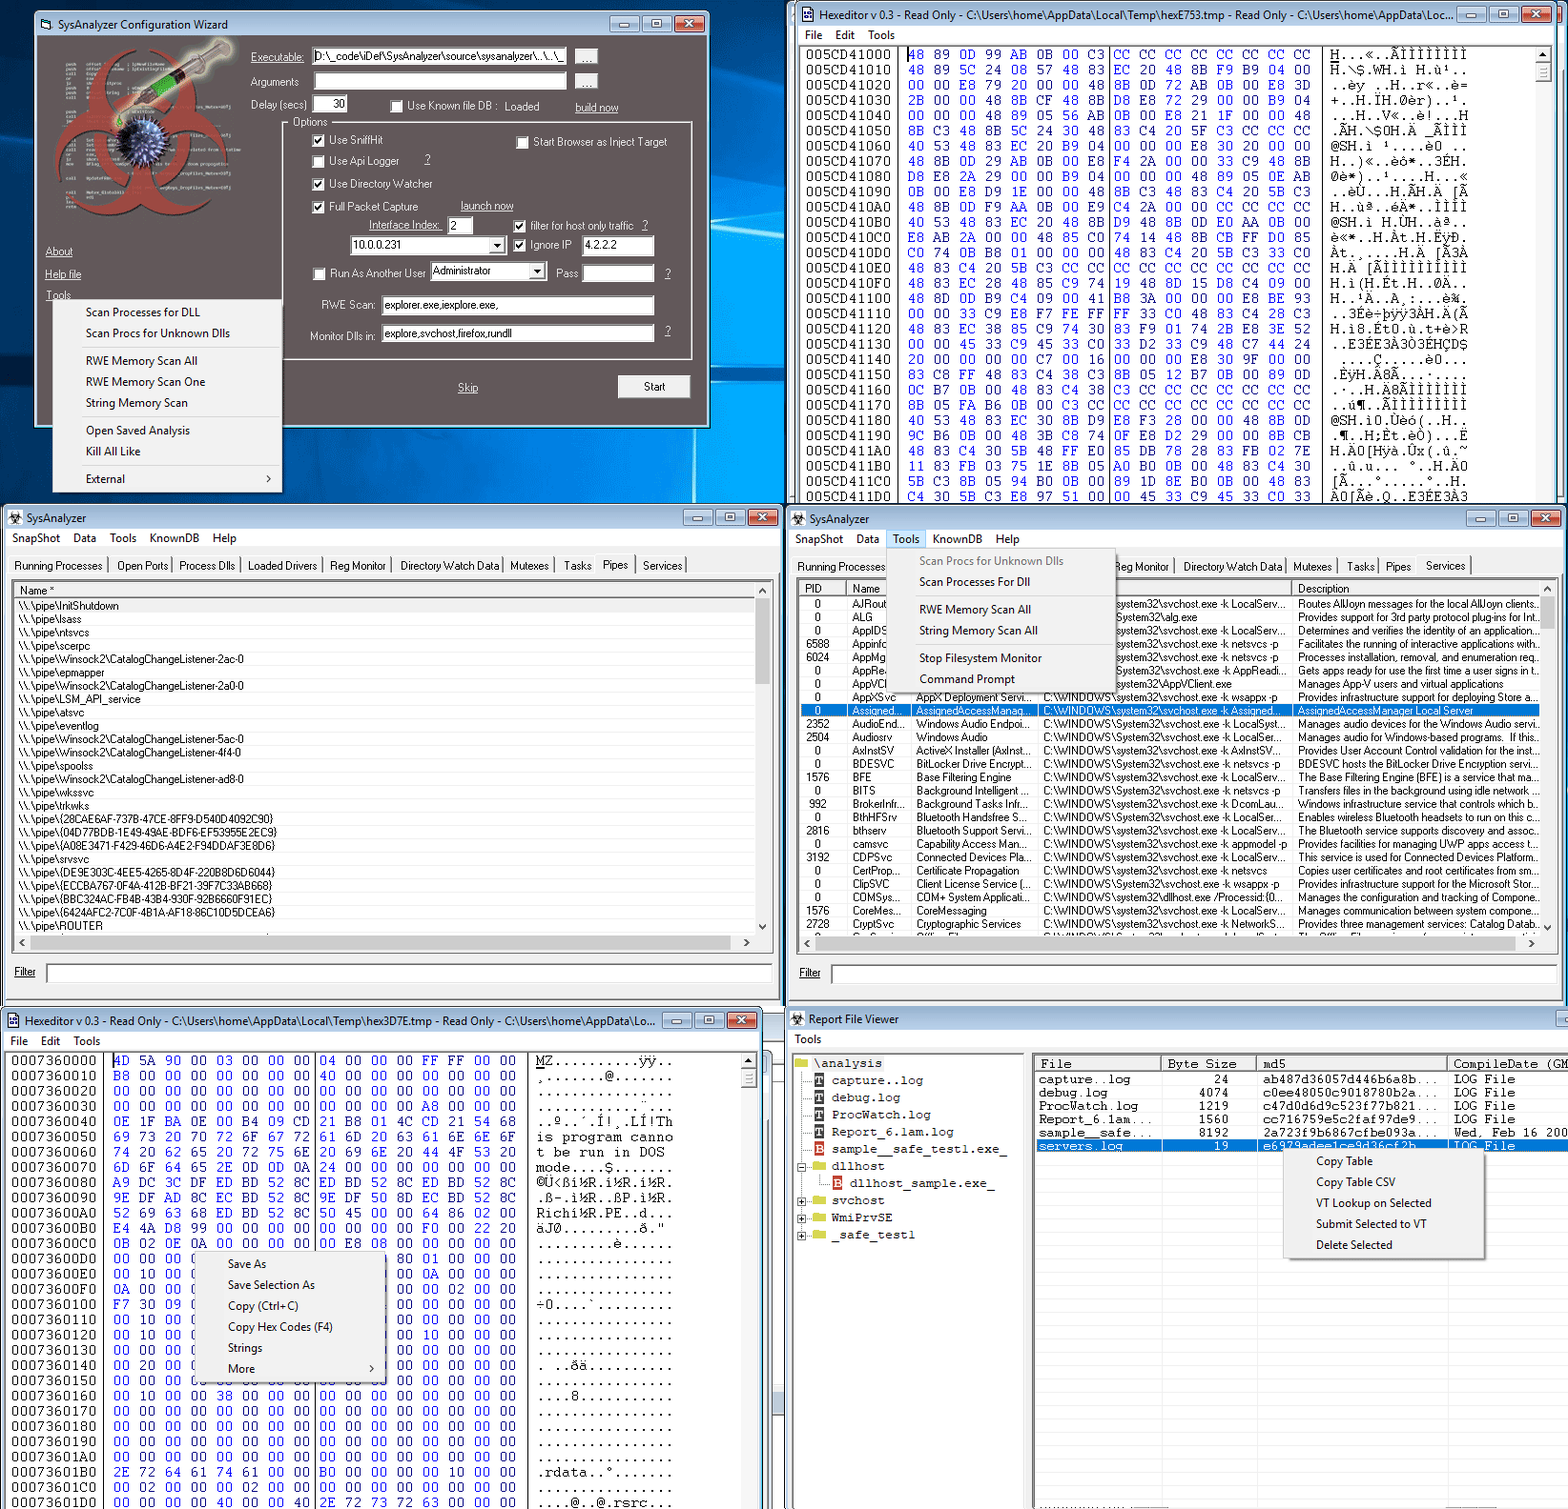
Some tabs have their own options, buttons, and right click menus such as the running process tab shown above. Users are encouraged to explore the interface and its different settings. They should all be straight forward and will not be discussed more in depth here.
If the user pressed the Start button on the wizard interface, a label on the main form will display a count down before the "after" snapshot is taken and analysis concludes.
When the timer reaches 0, the second snapshot will be taken, and the diff report displayed in the main interface. The auto analysis features will do the followiung:
- scan for any new processes and save a copy of the file, its memory dump, and strings output from the dump file to /analysis/[process name]
- scan any processes for RWE memory sections, and take a strings dump
- scan specified system processes for RWE memory sections, and take a strings dump
- do a full packet capture if specified at startup
- sniffHit option will record all unique IP's, DNS requests, and a text based HTTP and IRC log
- API logger will record a bunch of useful API results
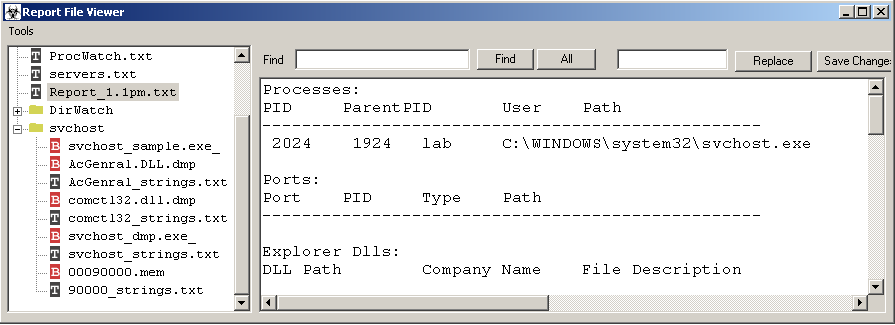
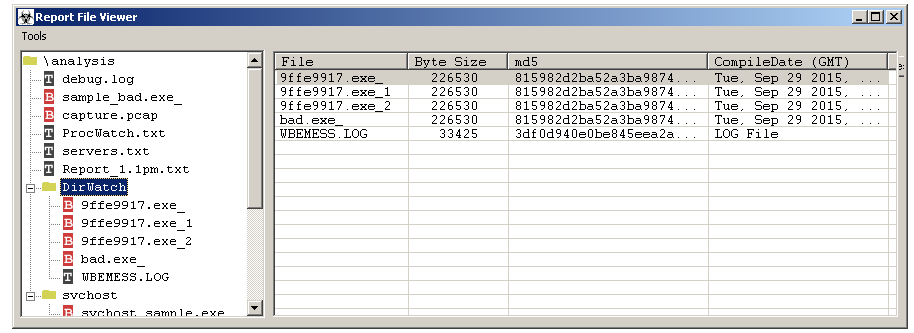
the report viewer form also includes several embedded actions. If you click on a PCAP it will automatically launch the associated viewer application for it. If you click on one of the folder icons, it will display all the hashes and file properties of the files within it.
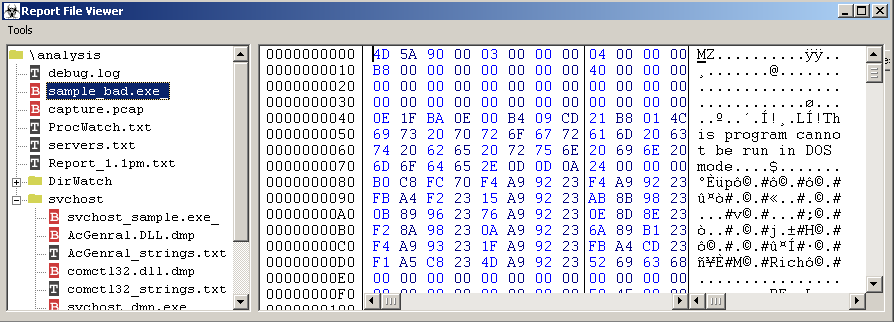
if you click on a binary file with a red b icon, then the file will automatically be displayed in an embedded hex editor.
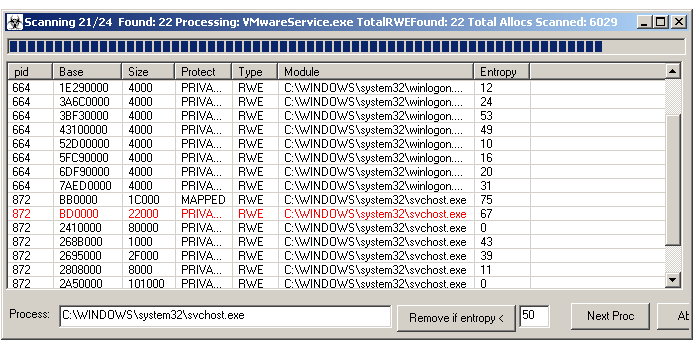
SysAnalyzer also has the capability to scan all running processes for a DLL name that you specify, or to scan their memory maps looking for Read Write Execute sections. If an entry turns up in red, then an MZ header was found in the injection and it is known bad. You can also double click on an entry to bring up a hexeditor form to view or save it to disk. The hexeditor also supports several useful features such as performing searches and strings dumps on the memory section.
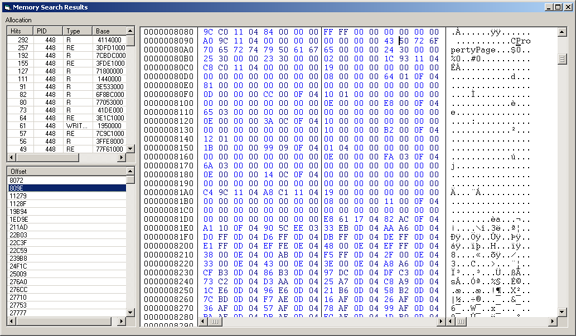
SysAnalyzer also includes a powerful memory scanner which looks for user specified regular expression. This can be launched from the memory map window of a specific process, or from a RWE memory scan listing encompassing multiple processes. This search also supports 64 bit processes. Results are shown in a seperate viewer form. The searchs supports both ASCII and Unicode strings as well as binary sequences( ex: \x90\x90\xeb\x15 )
