 |
Sleuth Browser Extensions Moving into an Existing Web Application |
If you are a developer that is coming into a project half way through its
life cycle, or find yourself as the new maintainer of an application it can
take you quite a while to become familiar with its intricate design, nested
frame layouts, and complex code.
This paper is an introduction to a set of free tools that is aimed specifically
at boosting your efficiency in these situations and allows you to familiarize
yourself and analyze foreign web applications in a relatively efficient manner.
These tools were first developed to allow web application auditors a method
to quickly gain insight into the layout, function and design of complex html
pages. These same tools also make quite useful utilities for the developer as
we will see shortly.
The Sleuth Browser Extensions package from SandSprite.com is a toolbox of
handy utilities that integrate right into the Internet Explorer Shell. They
include tools to:
| 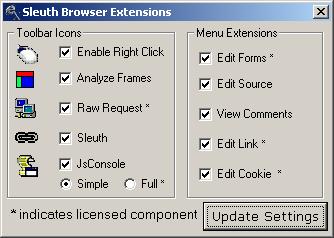 |
Sleuth Extensions will integrate these powerful new tools right into the IE shell.
These new tools will allow you to analyze and alter any web page that you are
currently viewing in Internet Explorer. This means that you are not stuck wading
though hundreds of lines of HTML to understand a complex frame layout, and do not
have to continually have to edit the source to test new scripting commands.
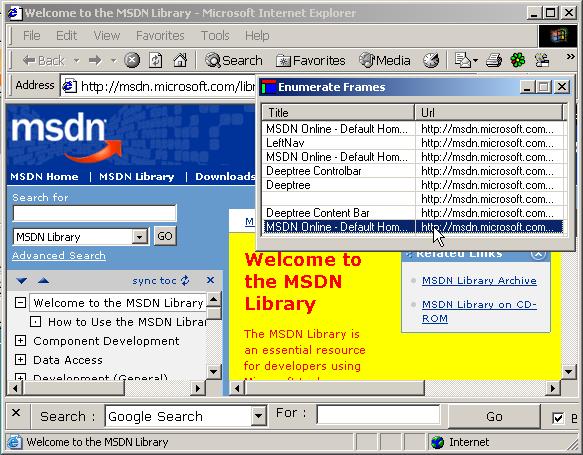
The frames overview component, pops up a window that lists all of the frames nested
into the document by title and url. Clicking on a specific frame in the list will highlight
that frame in the actual webpage by turning its background color yellow.
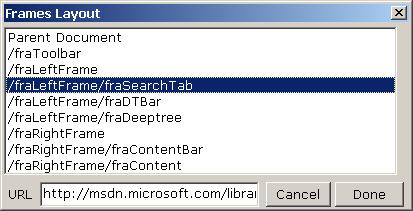
By right clicking on the list you can also select the option "View Layout" which will
recursively analyze the entire window and present you with all of the frames by name
and nesting. Clicking on a Frame entry in the list will reveal its url in the lower
listbox.
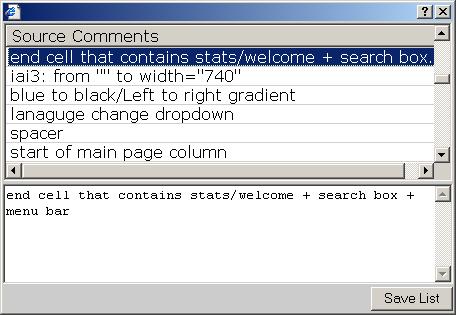
Another thing that can quickly help you move into that new web application is if the
previous author was kind enough to leave behind some comments. For this, a right click
menu item was added to the standard IE context menu that will parse and display all comments
found in the page. This utility works on a per frame basis. If you want to see
a specific frames comments, just right click on that frame.
When first walking through a new web application it is also common to wonder how a specific feature was implemented. For this I have also added in a view source menu item. This will display the html of the specific frame or page in a nice syntax highlight control and allow you to search and optionally alter and update the page you were viewing.
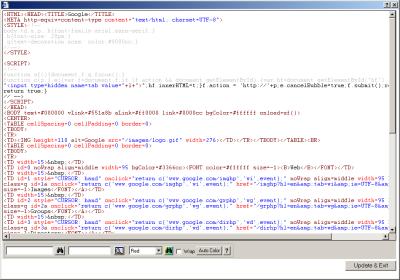
This easy editing ability also allows you to experiment and fix tag or page errors.
Lets move to another situation. Lets say you have some select boxes or list elements that
are being built up automatically from dynamic data and are trying to write some javascript
to interact with them. You will frequently find yourself stuck in the change, save, reload pattern.
With the Javascript Console extension, now you can test and debug your scripts interactively
with the generated page without having to go through all of the other steps!
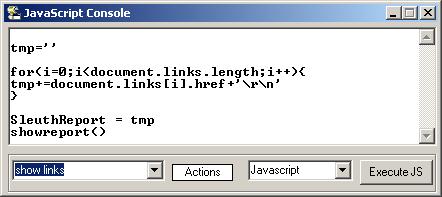
The javascript console is also a great utility to test and analyze the pages you are
viewing. With a little creativity you can easily have it generate a listing of links, form
elements, or dynamically change things on the fly. The javascript console also comes with
a handy mechanism to automatically store a list of your favorite scripts. There are 2 versions
of the jsConsole. The free version is a bare bones light weight utility:
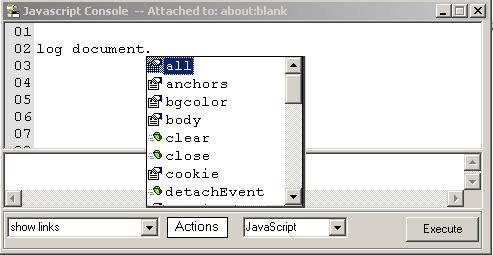
The full version of the jsConsole includes advanced features such as syntax highlighting, intellisense, error line highlighting, ability to attach to any IE window, as well as a robust logging capability.
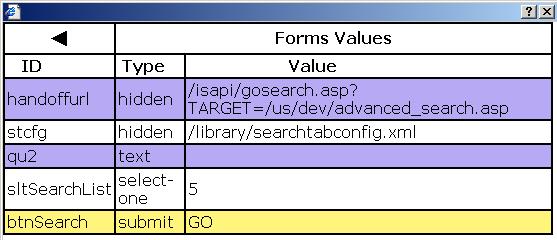
The last utility we will discuss here is the forms editor. By right clicking on the
specific frame or page, you can now access a forms analyzer. The analyzer bring up a new
window that lists all of the html forms in the document. Clicking on a specific form
will generate a listing of all of its form elements by name, type and value. Here you can
also edit specific form values (yes even hidden form elements) to test your scripts
behaviors.
Hopefully these new utilities will make your life a little bit easier and help
you move more quickly into web applications you have become responsible for.
You should also find that these same utilities are quite useful for testing,
debugging, and experimenting with web technologies.
This article and tools were developed as a supplement to the SandSprite.com
product Sleuth. Sleuth is a robust web application analysis tool that allows auditors and
developers alike a framework to properly test their web applications right down to the http
header interactions.
Sleuth Browsers Extensions are now packaged with the current Sleuth installer
| © All rights reserved | - SandSprite.com - 2003 |

|